The bias-variance tradeoff is the central framework for understanding prediction error in machine learning. Ensembles are the most practical tool for navigating it — bagging directly reduces variance, boosting directly reduces bias. This article makes the decomposition concrete with experiments, shows exactly how each ensemble strategy targets a different component of error, and provides a diagnostic framework for identifying which component is limiting your current model.
1. Problem Statement
You train a deep decision tree and it achieves 99% training accuracy but 84% test accuracy. You retrain a logistic regression and it achieves 88% training and 87% test accuracy. The tree overfits; the linear model underfits. Neither is satisfying. The question is: what is the precise mechanism by which ensembles close this gap? And given a new model whose training and test performance you can observe, how do you know which ensemble strategy to apply?
2. Why This Matters
Without the bias-variance framework, ensemble tuning is guesswork. More base learners? Shallower trees? Higher learning rate? Each choice targets a different error component. Applying the wrong strategy — adding more trees to a high-bias model, for instance — wastes compute without improving generalisation. Understanding which component dominates the error tells you exactly which lever to pull.
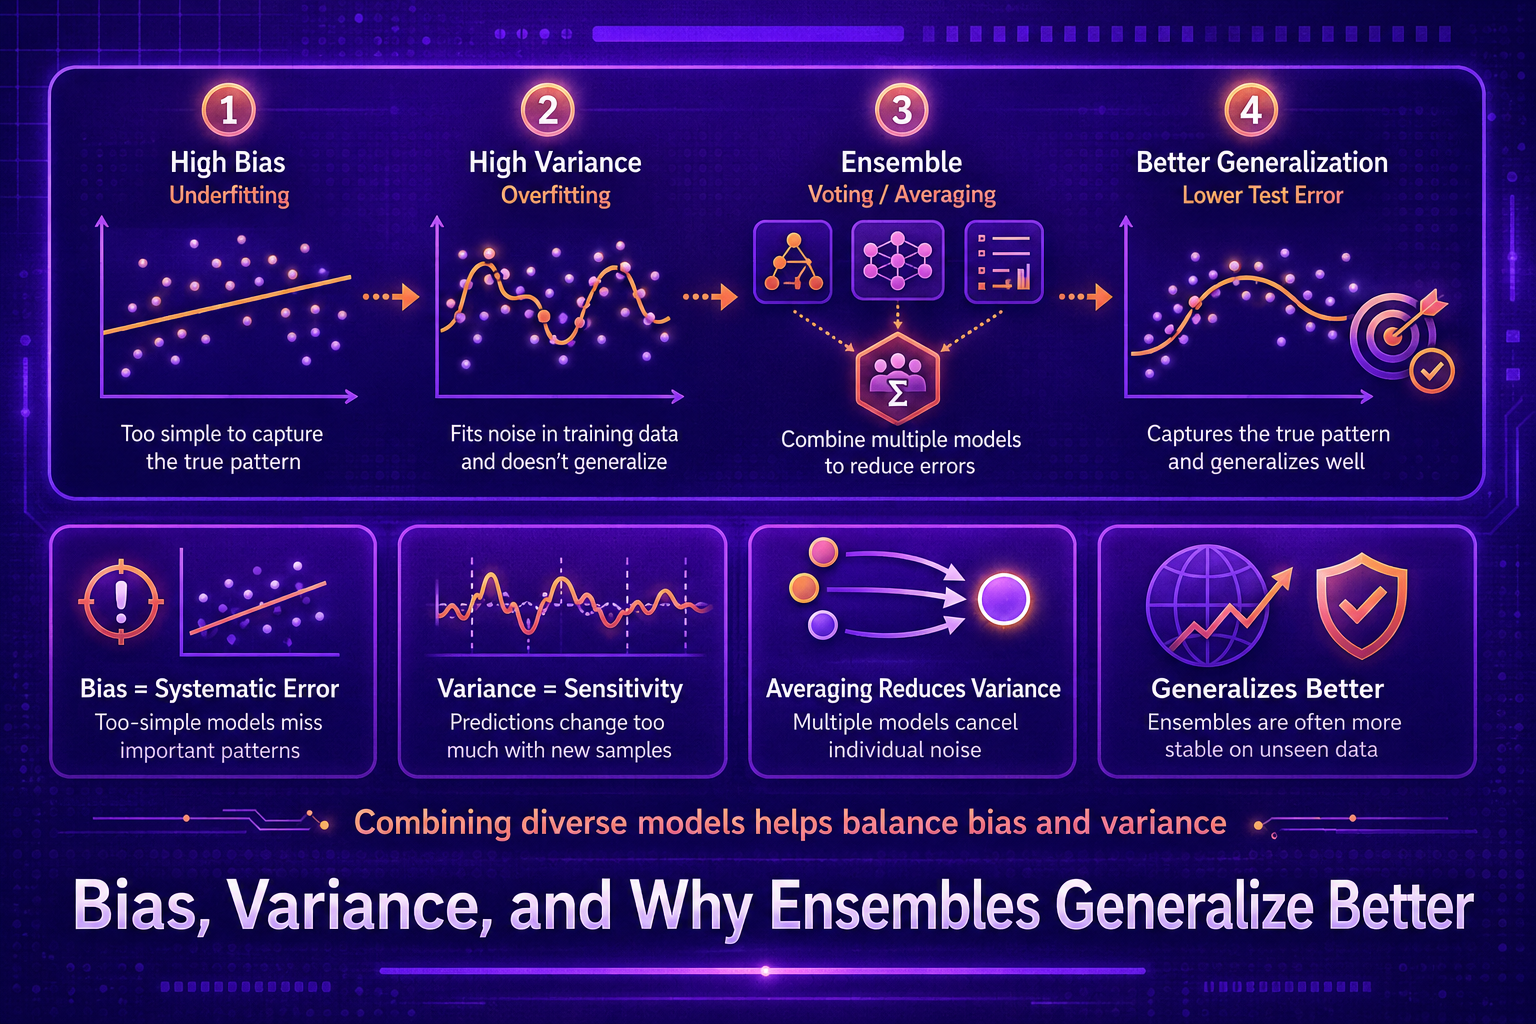
The framework also explains why ensemble methods work at all. It is not magic — it is a precise mathematical mechanism: averaging reduces variance when predictions are independent, and sequential correction reduces bias when errors are systematic. Models that are good by intuition but bad by theory often fail in deployment; models built around the decomposition rarely do.
3. The Approach
We use a bias-variance decomposition experiment: train many models (each on a different bootstrap sample of the training data), observe how their predictions vary across samples (variance), and compare the average prediction to the true labels (bias). The total expected error equals bias squared plus variance plus irreducible noise. We then apply bagging and boosting and show experimentally — not just theoretically — how each one moves the needle on each component.
4. Mathematical Foundation
For a regression model f̂ trained on dataset D, the expected squared error at a point x decomposes as:
ED[(y − f̂(x))2] = Bias²(f̂(x)) + Var(f̂(x)) + σ²
where:
Bias(f̂(x)) = ED[f̂(x)] − f(x)
Var(f̂(x)) = ED[(f̂(x) − ED[f̂(x)])2]
and σ² is the irreducible noise — the variance of y given x that no model can eliminate.
For a bagging ensemble of T base learners, each trained on an independent bootstrap sample, the ensemble prediction is H(x) = (1/T) Σt=1T f̂t(x). Under the independence assumption:
Var(H(x)) = Var(f̂(x)) / T
In practice learners are correlated (pairwise correlation ρ), so:
Var(H(x)) = ρ · Var(f̂) + (1−ρ) · Var(f̂) / T
Crucially, the bias of the ensemble equals the bias of any individual learner: Bias(H(x)) = Bias(f̂(x)). Bagging does not reduce bias — only variance. Boosting works differently: it adds learners that systematically correct residuals, which directly targets the bias term. The variance of boosted ensembles can initially increase with more rounds before the regularisation from shrinkage brings it back down.
5. Algorithm Walkthrough
To estimate bias and variance empirically for a model class M:
- Generate B bootstrap samples from the training distribution.
- Train one copy of M on each bootstrap sample: models
f̂1, ..., f̂B. - For each test point x, collect all B predictions:
ŷ1(x), ..., ŷB(x). - Estimate bias:
B̂ias = mean(ŷb(x)) − y(x)(averaged over test points). - Estimate variance:
V̂ar = Var(ŷb(x))(variance of predictions across bootstrap replicates, averaged over test points). - Total error ≈ B̂ias² + V̂ar + σ².
Repeating this for multiple model families (shallow tree, deep tree, bagged ensemble, boosted ensemble) shows directly how each one allocates error between bias and variance.
6. Dataset
This article uses two synthetic datasets from scikit-learn. The first, generated with make_regression, creates a continuous regression target with controlled noise — essential because the bias-variance decomposition is cleanest for regression, and we know the true function exactly. The second, generated with make_classification, demonstrates the classification version. Using synthetic data means we can compute true bias and variance, not estimates corrupted by unknown ground truth. Open Notebook
7. Implementation
The notebook implements a bootstrap bias-variance estimator from scratch (not provided by scikit-learn directly), then applies it to four model classes: a shallow decision tree (high bias, low variance), a deep decision tree (low bias, high variance), a bagging ensemble, and a gradient boosting ensemble. Bar charts show the decomposition for each, and a sweep over model complexity (tree depth) shows the classic bias-variance curve with ensemble overlays.
def bias_variance_decomp(model, X_train, y_train, X_test, y_test, n_bootstrap=100):
    preds = np.zeros((n_bootstrap, len(y_test)))
    for i in range(n_bootstrap):
        idx = np.random.choice(len(X_train), len(X_train), replace=True)
        model.fit(X_train[idx], y_train[idx])
        preds[i] = model.predict(X_test)
    mean_pred = preds.mean(axis=0)
    bias_sq = np.mean((mean_pred - y_test)**2)
    variance  = np.mean(preds.var(axis=0))
    return bias_sq, variance
8. Evaluation Approach
For regression, bias² and variance are reported in units of squared error — the same units as MSE. For classification, we use the 0/1 loss decomposition (Kohavi and Wolpert, 1996): bias is the probability that the average prediction differs from the Bayes-optimal prediction; variance is the probability that a prediction differs from the average. The notebook reports all quantities numerically and as stacked bar charts to make the relative contributions visually obvious.
9. Results and Interpretation
A deep decision tree (no depth limit) typically shows very low bias (~0.01 in normalised MSE units) but high variance (~0.25). A shallow tree (depth=2) shows higher bias (~0.15) but low variance (~0.04). The bagging ensemble over deep trees reduces variance from ~0.25 to ~0.04 — matching the shallow tree — while keeping bias low. Gradient boosting, starting from shallow stumps, reduces bias from ~0.15 to ~0.02 while adding modest variance. The ensemble in both cases outperforms both extremes of the single-model bias-variance curve.
10. Hyperparameter Considerations
For bagging, n_estimators directly controls variance: the variance reduction formula predicts that 50 trees reduces variance to 1/50 of a single tree (minus the correlation penalty). The max_features parameter controls base learner correlation: lower max_features → more diverse trees → lower ρ → more variance reduction per tree. For boosting, the learning_rate (shrinkage) parameter controls the rate of bias reduction per round and the final bias-variance balance. Lower learning rates converge more slowly but tend to produce better-calibrated final variance.
11. Comparison with Baseline
The bias-variance plot is the comparison. A single deep tree sits at the low-bias, high-variance corner. A single shallow tree sits at the high-bias, low-variance corner. Bagging moves the deep tree left along the variance axis without moving up the bias axis. Gradient boosting moves the shallow tree down along the bias axis with modest variance cost. Both ensembles achieve total errors lower than either individual extreme — this is the geometric intuition for why ensembles beat single models.
12. Strengths
- The bias-variance decomposition is a universal diagnostic: it applies to any model class and any loss function (with appropriate generalisation of the decomposition).
- The decomposition gives a principled basis for choosing between bagging and boosting: if variance dominates, bag; if bias dominates, boost.
- Ensemble variance reduction is theoretically guaranteed under the independence assumption — it is not an empirical hope but a mathematical property.
- The decomposition also explains why ensemble improvements are often larger for unstable models (deep trees) than stable ones (shallow trees): unstable models have high variance, which is precisely what bagging targets.
13. Limitations
- The decomposition assumes the squared error loss for regression. For classification, multiple non-equivalent decompositions exist (Domingos, 2000; Kohavi and Wolpert, 1996), and the additivity property does not hold cleanly under 0/1 loss.
- The independence assumption in the variance reduction formula is violated whenever base learners share training data or features. The actual reduction is ρσ²/T + (1−ρ)σ² rather than σ²/T.
- The decomposition is a useful diagnostic but does not account for model capacity constraints, computational cost, or deployment latency — factors that often dominate the model selection decision in practice.
14. Common Failure Modes
- Applying bagging to a high-bias model (e.g., logistic regression on a non-linearly separable dataset). Bagging cannot fix bias — the ensemble mean will be just as wrong as any individual model. Use a more expressive base learner or apply boosting instead.
- Applying boosting without regularisation (low learning_rate, early stopping, or max_depth constraints on stumps). Boosting reduces bias aggressively but can overfit with too many rounds, pushing variance back up.
- Confusing training error with bias. Training error conflates bias and the model’s ability to memorise. True bias is the gap between the average prediction (across bootstrap replicates) and the ground truth — it cannot be read off training accuracy alone.
- Expecting ensembles to reduce irreducible noise. σ² is a property of the data-generating process, not the model. No amount of ensembling eliminates noise that is inherent in the labels.
15. Best Practices
- Diagnose which component dominates before choosing an ensemble strategy: large train-test gap → high variance → bag; both train and test error high → high bias → boost or use a more expressive base learner.
- Maximise diversity to reduce ρ and increase variance reduction efficiency: use random feature subsets (max_features) in addition to bootstrap sampling.
- Monitor the bias-variance balance during boosting by tracking training error (bias proxy) and cross-validation error (total error) together — divergence signals the onset of overfitting.
- For small datasets where bootstrap variance is high, use repeated k-fold cross-validation rather than a single train-test split to measure bias and variance more reliably.
16. Conclusion
The bias-variance decomposition is not an abstract theoretical exercise — it is a practical decision tool. Every modelling choice affects bias, variance, or both: model family, complexity, regularisation, training set size, and ensemble strategy all shift the decomposition. Ensembles are uniquely powerful because they let you address these two sources of error semi-independently: bagging targets variance without touching bias; boosting targets bias with controlled variance cost.
Understanding the decomposition transforms ensemble selection from trial-and-error to directed engineering. When the gap between training and test performance is large, you know to bag. When both are high, you know to boost or increase model capacity. When performance is near the noise floor and neither gap is large, you know you have done all you can without more data. This diagnostic clarity is one of the most durable benefits of building machine learning intuition on the bias-variance framework.