Fairness metrics in machine learning are quantitative criteria used to assess whether a model’s predictions, decisions, or error patterns differ across groups in ways that may be unacceptable, harmful, or inconsistent with policy goals. These metrics are central to responsible AI because overall predictive accuracy alone cannot reveal whether a system is treating groups equitably. This whitepaper explains the mathematical foundations, interpretations, trade-offs, and practical use of fairness metrics in ML.
Abstract
Machine learning systems increasingly influence decisions in lending, hiring, insurance, healthcare, education, public services, fraud detection, advertising, and content moderation. In these settings, a model can perform well on aggregate while still imposing systematically different burdens or benefits on different groups. Fairness metrics are used to quantify such disparities and support model evaluation, governance, mitigation, and monitoring. This paper explains the major fairness metrics used in machine learning, including demographic parity, disparate impact, equal opportunity, equalized odds, predictive parity, calibration, treatment equality, subgroup metrics, and related error-rate comparisons. It also explains why different fairness metrics can conflict, how base rates affect these conflicts, and how fairness metrics should be interpreted within broader socio-technical context. All formulas are embedded inline in HTML-friendly format for direct use in WordPress or similar editors.
1. Introduction
Let a classifier produce a prediction
ŷ ∈ {0,1}
from input features x. Let
Y ∈ {0,1} denote the true label, and let
A denote a sensitive attribute such as group membership.
Fairness metrics aim to compare model behavior across values of A. For example, one
may compare:
- prediction rates
- true positive rates
- false positive rates
- precision
- calibration quality
If these differ substantially across groups, the model may warrant fairness concern depending on the domain and decision context.
2. Why Fairness Metrics Matter
Standard model metrics such as accuracy or AUC summarize performance globally, but they do not indicate whether the system behaves differently for different populations. A model can achieve strong overall accuracy while still:
- missing qualified individuals from one group more often
- producing more false alarms for another group
- allocating opportunity unevenly
- yielding scores that mean different things across groups
Fairness metrics matter because they make such disparities visible and measurable.
3. Basic Classification Quantities
Many fairness metrics are built from confusion-matrix quantities:
TP, FP,
TN, and FN.
These define common rates:
TPR = TP / (TP + FN),
FPR = FP / (FP + TN),
TNR = TN / (TN + FP),
FNR = FN / (FN + TP),
and
PPV = TP / (TP + FP).
Fairness metrics often compare these quantities group by group.
4. Group-Based Evaluation Setup
Suppose the sensitive attribute takes values A = a and
A = b. A fairness metric generally studies whether:
Metric(A = a) = Metric(A = b)
or whether the difference is small enough to be acceptable.
In practice, one often compares either a difference:
Δ = Metric(a) - Metric(b)
or a ratio:
R = Metric(a) / Metric(b).
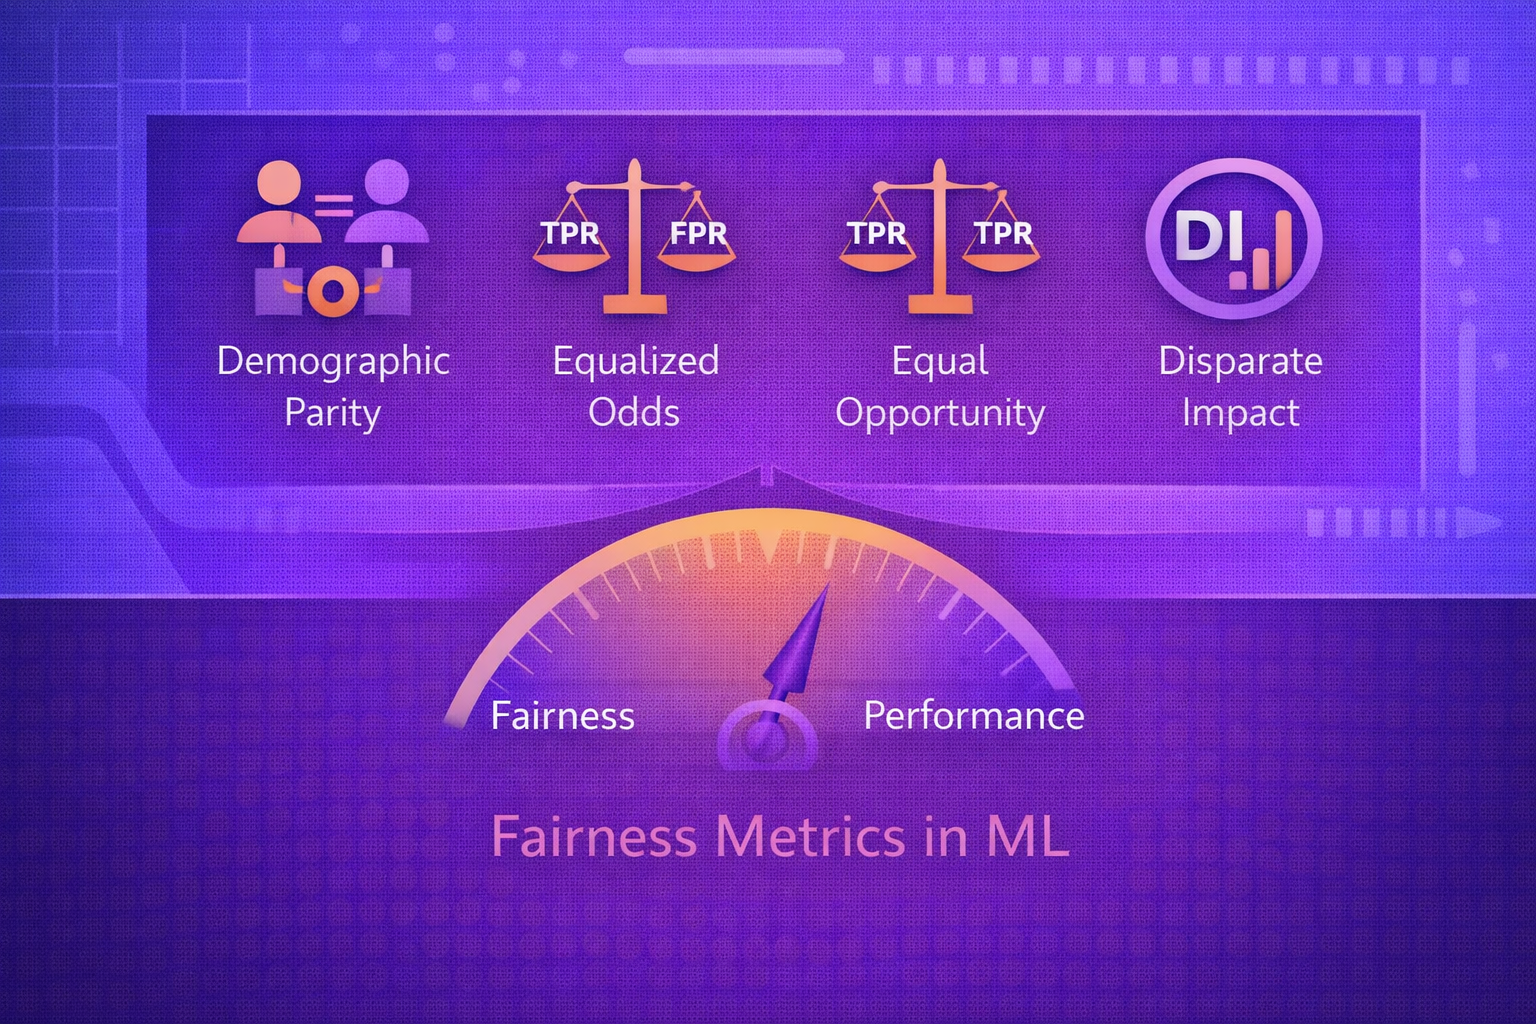
5. Demographic Parity
Demographic parity, also called statistical parity, requires equal positive prediction rates across groups:
P(ŷ = 1 | A = a) = P(ŷ = 1 | A = b).
This means the model predicts the positive outcome at equal rates regardless of group membership.
5.1 Interpretation
Demographic parity focuses on parity of outcomes, not on whether the outcomes are correct. It may be desirable when equal allocation rates matter, but it can also ignore real differences in underlying label prevalence.
5.2 Difference and Ratio Forms
A demographic parity difference may be written as:
DPD = P(ŷ = 1 | A = a) - P(ŷ = 1 | A = b).
A ratio form is:
DPR = P(ŷ = 1 | A = a) / P(ŷ = 1 | A = b).
6. Disparate Impact
Disparate impact is closely related to demographic parity and is often expressed as a ratio of positive outcome
rates:
DI = P(ŷ = 1 | A = a) / P(ŷ = 1 | A = b).
It is often used in legal or policy-oriented discussions because it directly quantifies how much less frequently one group receives a favorable outcome than another.
7. Equal Opportunity
Equal opportunity requires equal true positive rates across groups:
P(ŷ = 1 | Y = 1, A = a) = P(ŷ = 1 | Y = 1, A = b).
In confusion-matrix terms, this means:
TPR(a) = TPR(b).
7.1 Interpretation
Equal opportunity focuses on qualified or truly positive cases. It is often used when fairness is understood as giving similarly deserving cases comparable access to a positive decision.
8. Equalized Odds
Equalized odds requires equal true positive rates and equal false positive rates across groups:
P(ŷ = 1 | Y = y, A = a) = P(ŷ = 1 | Y = y, A = b)
for both y = 0 and y = 1.
Equivalently:
TPR(a) = TPR(b)
and
FPR(a) = FPR(b).
8.1 Interpretation
Equalized odds is stricter than equal opportunity because it equalizes both access to true positives and exposure to false positives. It is often relevant when both missed opportunities and wrongful adverse actions matter.
9. Predictive Parity
Predictive parity requires equal positive predictive value across groups:
P(Y = 1 | ŷ = 1, A = a) = P(Y = 1 | ŷ = 1, A = b).
In confusion-matrix terms:
PPV(a) = PPV(b).
9.1 Interpretation
Predictive parity asks whether a positive prediction has the same reliability across groups. This matters when the decision-maker interprets a positive prediction as evidence of the same underlying likelihood regardless of group.
10. Negative Predictive Parity
Similarly, one may compare negative predictive value:
NPV = TN / (TN + FN).
Group equality in NPV asks whether a negative prediction carries the same reliability across groups.
11. Calibration
Calibration concerns whether predicted scores correspond to actual probabilities. If a model outputs score
s, calibration requires:
P(Y = 1 | S = s) = s.
Group-wise calibration requires:
P(Y = 1 | S = s, A = a) = s
and similarly for other groups.
11.1 Interpretation
Calibration is especially important when scores are used downstream for ranking, thresholding, or human review. If calibration differs across groups, then the same score may mean different real-world risk levels.
12. Treatment Equality
Treatment equality compares how different types of error are distributed across groups. One form uses the ratio:
FP / FN.
Group treatment equality would require:
(FP/FN)(a) = (FP/FN)(b).
This criterion reflects whether the relative burden of false positives and false negatives is balanced across groups.
13. Accuracy Parity
Accuracy parity requires equal overall classification accuracy across groups:
P(ŷ = Y | A = a) = P(ŷ = Y | A = b).
While simple, this metric can hide important asymmetries because equal overall accuracy can still occur with very different false positive and false negative patterns.
14. False Positive Rate Parity
False positive rate parity requires:
FPR(a) = FPR(b).
This is especially relevant when false positives impose serious harm, such as wrongful denial, false accusation, or unnecessary intervention.
15. False Negative Rate Parity
False negative rate parity requires:
FNR(a) = FNR(b).
This is relevant when missed positives represent lost opportunity, underdiagnosis, or failure to provide service to qualified individuals.
16. Base Rates and Fairness Conflicts
A central fact in fairness analysis is that many fairness metrics cannot all be satisfied simultaneously when base
rates differ across groups. If:
P(Y = 1 | A = a) ≠ P(Y = 1 | A = b),
then demographic parity, equalized odds, and predictive parity may conflict.
This is why fairness decisions require explicit prioritization rather than assuming all metrics can be optimized together.
17. Threshold Effects
Many models output scores s that are converted into decisions using threshold
τ:
ŷ = 1 if s ≥ τ, else 0.
Changing τ changes group-wise TPR, FPR, precision, and demographic parity behavior.
Fairness metrics are therefore often sensitive to threshold choice.
18. Group-Specific Thresholding
Some fairness interventions use different thresholds by group:
ŷ = 1 if s ≥ τa for one group and
ŷ = 1 if s ≥ τb for another.
This can help satisfy metrics such as equal opportunity or equalized odds, but it may raise legal, ethical, or policy concerns depending on the use case.
19. Individual Fairness
Beyond group fairness, individual fairness says that similar individuals should receive similar predictions. A
conceptual form is:
if d(xi, xj) is small, then d'(f(xi), f(xj)) should also be small.
The difficulty lies in defining what “similar” means in a normatively acceptable way.
20. Subgroup Fairness
Subgroup fairness extends beyond a few protected classes to many intersections and subsets. Instead of checking only
a small number of groups, one may evaluate fairness over a family of subgroups
G = {g1, g2, ..., gm}.
This is important because aggregate fairness over broad groups can hide unfairness in intersecting minorities.
21. Fairness in Regression and Ranking
Fairness is not limited to binary classification. In regression, one may compare error metrics by group such as:
MAE(a) = (1/na) Σ |yi - ŷi|.
In ranking systems, fairness may concern exposure, ordering, or utility allocation rather than only binary outcomes.
22. Fairness Metrics in Generative AI
In generative models, fairness is harder to summarize with classic classification metrics. One may instead measure:
- representation balance
- toxicity disparities
- stereotype prevalence
- refusal consistency across prompt categories
- quality parity across languages or groups
These are often benchmark- and audit-driven rather than purely confusion-matrix-driven.
23. Choosing the Right Fairness Metric
The appropriate fairness metric depends on the decision context:
- Use demographic parity when equal allocation rates are the priority.
- Use equal opportunity when access for truly qualified cases matters most.
- Use equalized odds when both false positives and false negatives are sensitive.
- Use calibration when scores must mean the same thing across groups.
- Use predictive parity when positive predictions should carry equal reliability.
No metric is universally best.
24. Fairness Metrics and Mitigation
Fairness metrics are not only for auditing; they also guide mitigation. A training objective may incorporate a
fairness penalty:
minθ L(θ) + λ Ωfair(θ),
where Ωfair measures disparity according to a chosen fairness criterion.
The fairness metric selected for evaluation should align with the mitigation goal.
25. Monitoring Fairness Over Time
Fairness metrics should be monitored after deployment because data distributions and user populations change over
time. If group-specific metric is:
Mg(t),
monitoring should detect whether
Mg(t)
drifts or diverges materially across groups.
A model that was fair at launch may become less fair under distribution shift.
26. Statistical Significance of Fairness Gaps
Observed fairness gaps can be noisy, especially in small subgroups. Teams should often compute confidence intervals or significance tests for group differences rather than relying only on point estimates.
For example, if a fairness gap estimate is
Δ̂, an uncertainty interval may be expressed as:
Δ̂ ± z · SE(Δ̂).
27. Common Pitfalls
- using only one fairness metric without understanding its limitations
- evaluating only aggregate performance
- ignoring subgroup sample size and statistical uncertainty
- assuming fairness metrics are interchangeable
- forgetting that fairness is partly normative, not purely technical
- measuring fairness once and never monitoring it again
28. Strengths of Fairness Metrics
- make group disparities visible and measurable
- support model auditing and accountability
- provide targets for mitigation and governance
- help connect technical evaluation with policy concerns
- improve trust in high-stakes AI systems
29. Limitations of Fairness Metrics
- different metrics can conflict
- metrics do not solve normative disagreement automatically
- measurement quality and labeling bias can distort metric meaning
- small subgroup sizes can make estimates unstable
- fairness metrics do not capture every social harm
30. Best Practices
- Choose fairness metrics based on the actual decision context and harm model.
- Always evaluate subgroup metrics alongside overall performance.
- Use both difference-based and ratio-based views when relevant.
- Document why a specific fairness metric was selected and what trade-offs it implies.
- Check uncertainty and subgroup sample size before drawing strong conclusions.
- Monitor fairness continuously after deployment, not just during model development.
31. Conclusion
Fairness metrics in machine learning provide the mathematical language for detecting and discussing unequal model behavior across groups. They are essential because aggregate performance measures alone cannot reveal whether a system distributes errors, opportunities, and risks equitably.
At the same time, fairness metrics are not plug-and-play moral truth functions. Different metrics reflect different notions of fairness, and those notions often conflict when group base rates differ. The correct use of fairness metrics therefore requires mathematical understanding, domain knowledge, governance discipline, and explicit normative judgment. When used carefully, fairness metrics are among the most important tools for building more accountable and responsible AI systems.